Chapter 01 · Section 1.1
Position Profiles - 3
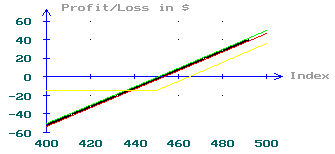
The green Profit/Loss profile corresponds to a long spot position.
The red profile corresponds to a long futures position (identical capital exposure)
The yellow line corresponds to a long call position. (identical capital exposure)
              INDEX VALUE          400.00      450.00    500.00
Profit/Loss   Stock Portfolio:     -50.00$     0.00$    50.00$
Return in $                        -11.11%     0.00%    11.11%

              Futures Position     -52.97$    -2.97$    47.03$
                                   -116.94%   -6.55%    103.83%

              Call Position        -14.29$   -14.29$    35.71$
                                   -100.00%  -100.00%   249.82%