Chapter 03 · Section 3.1
Adjusted Distribution-1
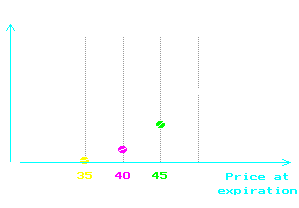
This graph shows the result of the calculation of the call value (the expected gain) when using the probability distribution coresponding to each of the plotted points.
Chapter 03 · Section 3.1
This graph shows the result of the calculation of the call value (the expected gain) when using the probability distribution coresponding to each of the plotted points.