Chapter 06 · Section 6.1
Purchasing a Call
As most option positions used for speculation are not necessarily held until expiration, it is important to analyze the profit/loss profile associated at a point in time before expiration. Let us look at the following example of a call purchase.
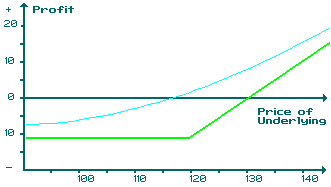
On August 20, the stock XXX trades at 117 and an investor buys an XXX 120 October call. The premium paid is 12 dollars per share.
Graphically, we can represent the position in the following manner:
Expiration profile: The green line on the graph represents the investor's profit/loss profile at expiration.
Current profile: The light blue line represents the investor's profit/loss profile in case he liquidates his positions now (for a given level of stock price volatility)