Chapter 02 · Section 2.1
Profit/Loss Diagrams for Basic Option Positions
You have probably seen graphs of this kind in the context of options:
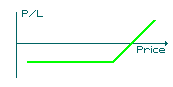
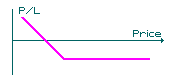
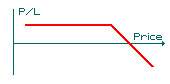
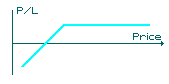
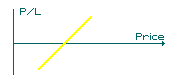
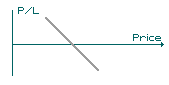
We call them profit/loss diagrams. They are used to illustrate the profit and loss potential inherent in a simple or combined option position. (Note: For these exercises we assume that transaction costs are zero.)