Chapter 02 · Section 2.1
The horizontal axis on the profit/loss diagram
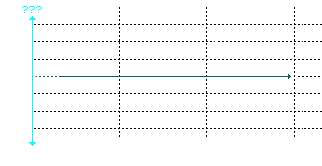 On the profit/loss diagram, the horizontal axis represents:
 a) the price of the underlying asset at the time the option is purchased.
 b) the price of the underlying asset at time of expiration/exercise.
 c) time until expiration.
 d) the option premium.
 e) None of the above.
 (Click here for help)