Chapter 02 · Section 2.1
Long put position
a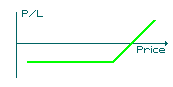 b
b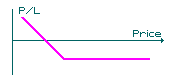
c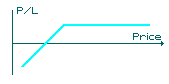 d
d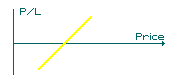
You have just seen the profit/loss diagram for a long call position. Which one of the diagrams above represents a long put position?
 a)
a)
 b)
b)
 c)
c)
 d)
d)
 Select the graph that represents a limited loss potential on the right hand side (rise in prices), and an unlimited profit potential on the left hand side.