Chapter 03 · Section 3.1
The diagram of the evolution
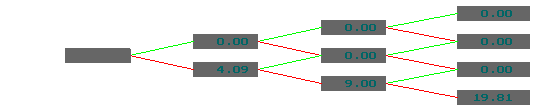
The diagram of the stock price evolution develops in this direction ------>
<--------The diagram of the put value evolution develops in this direction.
What is the price of the put?
 c) -2.05
No. You must take into account the risk free interest rate between these periods. In our example it is 10%. d) -0.01/1.85
 e) -1.87/99999
 f) +1.86
 a) --999999/-1
 b) -0
b) -0
 (Click here for help)