Chapter 05 · Section 5.1
Delta - Put
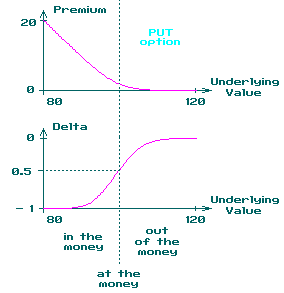 The top picture represents a put option 30 days before expiration with an exercise price of 100, the bottom graphic represents the delta profile of the put.
The delta is the slope of the line representing the option premium as a function of the price of the underlying.
The more a put is out-of-the-money, the closer the delta is to zero. The more a put is in-the-money, the closer the delta is to -1. When the put is at-the-money, the delta is 0.5.