Chapter 05 · Section 5.1
Gamma - Put
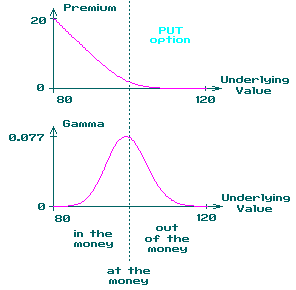
The top picture represents a put option 30 days before expiration with an exercise price of 100, the bottom graphic represents the gamma profile of the put.
The gamma factor describes the expected change in delta resulting from a one unit change in the price of the underlying.
The gamma profile resembles the bell curve.
Its maximum occurs when the put is at-the-money. As the put moves deep in-the-money or deep out-of-the-money the gamma approaches
zero. It is not however, always symmetrical about the center axis (at-the-money).