Chapter 02 · Section 2.1
Profit/loss diagrams are used to:
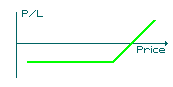
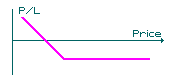
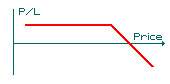
In general Profit/loss diagrams (like the ones you see above) are used to:
 b) illustrate the potential profit or loss inherent in a short option position.
No. The graph will look different in different cases, but it can represent both long and short options positions. c) illustrate the potential profit or loss inherent in an option, futures or spot position.
 d) None of the above
 a) illustrate the potential profit or loss inherent in a long option position.
 (Click here for help)