Chapter 02 · Section 2.1
Profit/loss diagrams are used to:
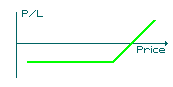
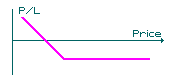
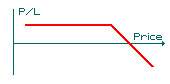
In general Profit/loss diagrams (like the ones you see above) are used to:
 c) illustrate the potential profit or loss inherent in an option, futures or spot position.
Yes. A profit/loss diagram can be drawn to represent any options, futures or forward position, even for a combined position of several instruments.Continue
 d) None of the above
 a) illustrate the potential profit or loss inherent in a long option position.
 b) illustrate the potential profit or loss inherent in a short option position.
 (Click here for help)